I need to make EMC limit charts (Some people refer to them as EMI charts) on my Emissions posts, Standards like CISPR 11 and CISPR 25 list their Emmision limit in tables like the one below.
This post about EMC charts is not about Equilibrium Moisture Content but about Electromagnetic Compatibility limit and emission plots and charts.
When I was working at CASS Industries, we used the same method to produce the emissions graphs in test reports. When I worked at ARRIVAL setting up the EMC Lab and facilities, I used the same process for making the charts and graphs in the EMC Component Standard.
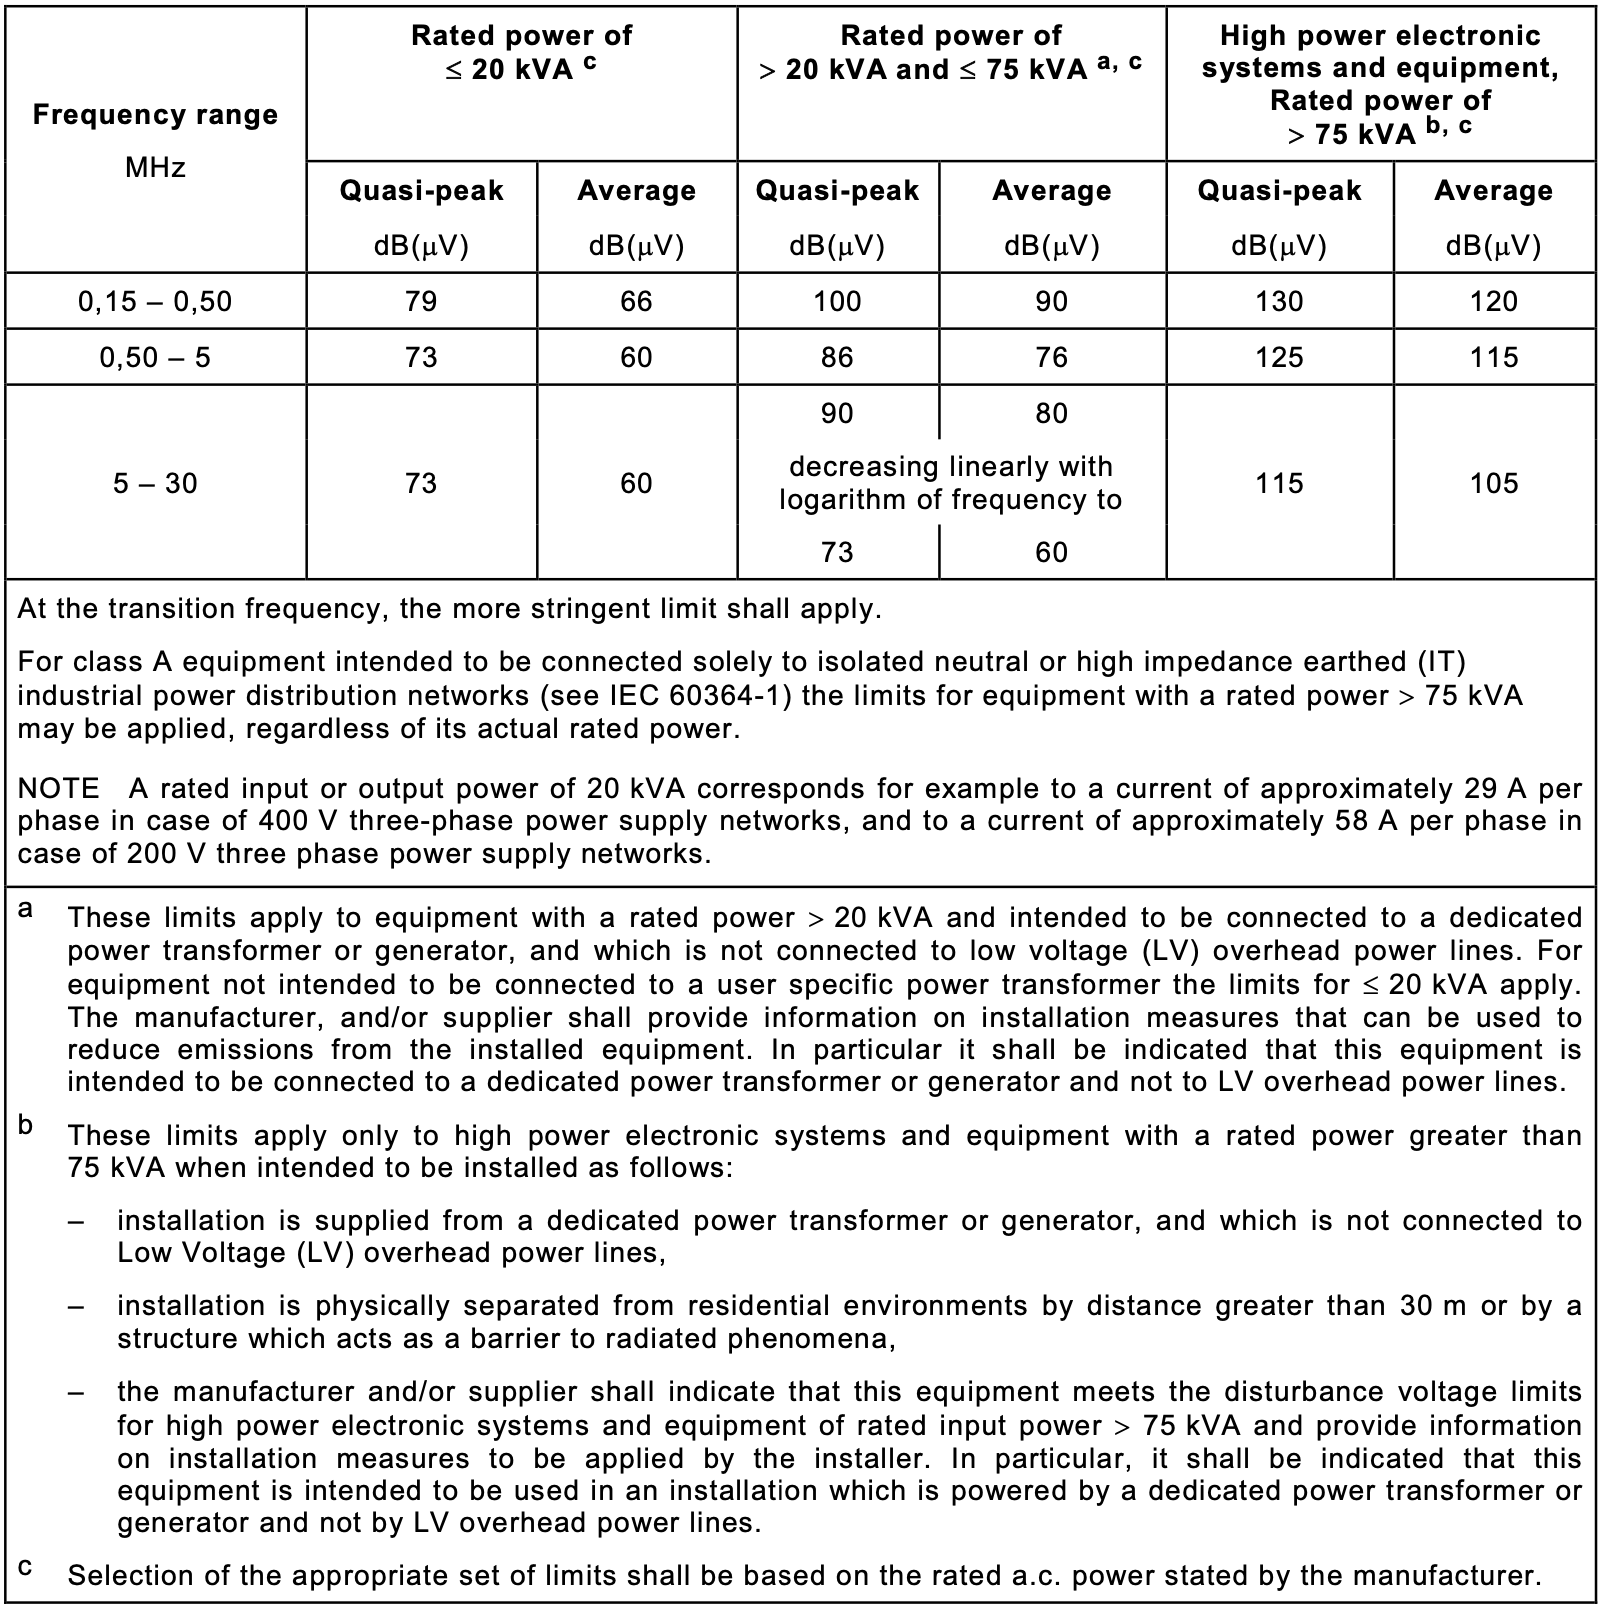
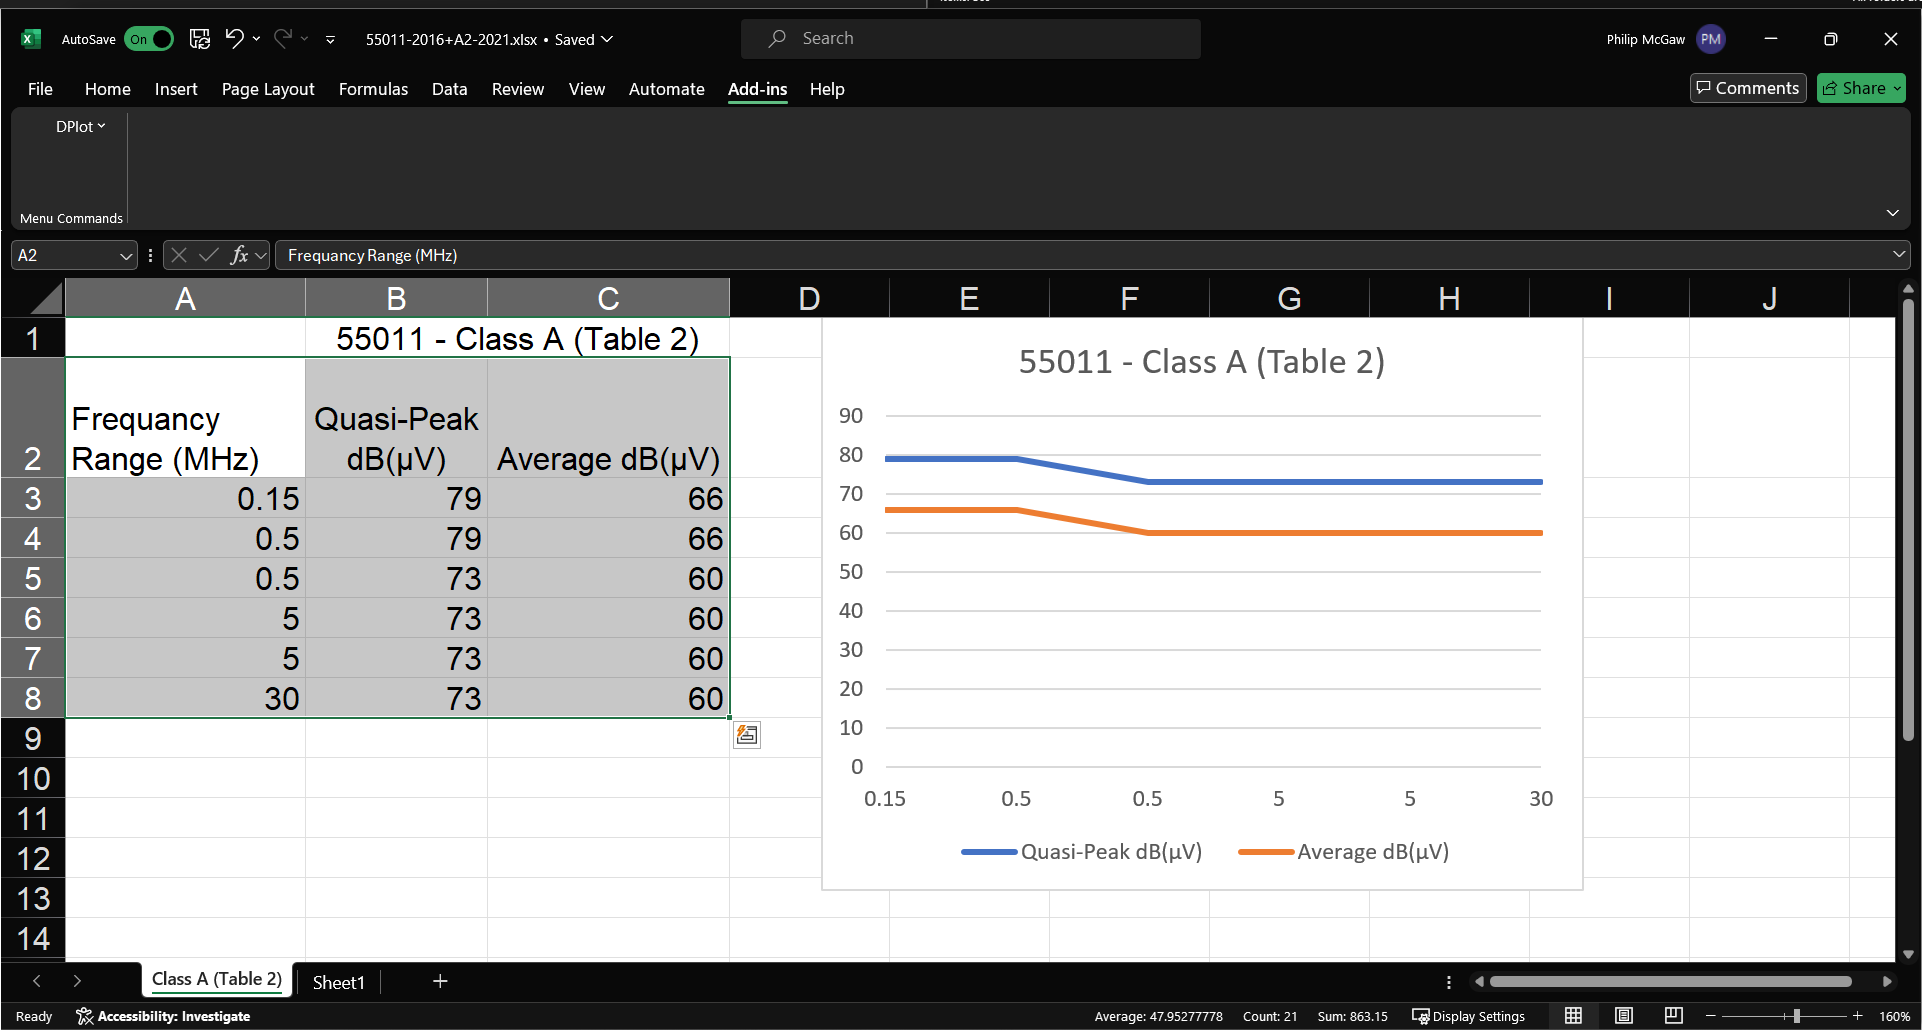
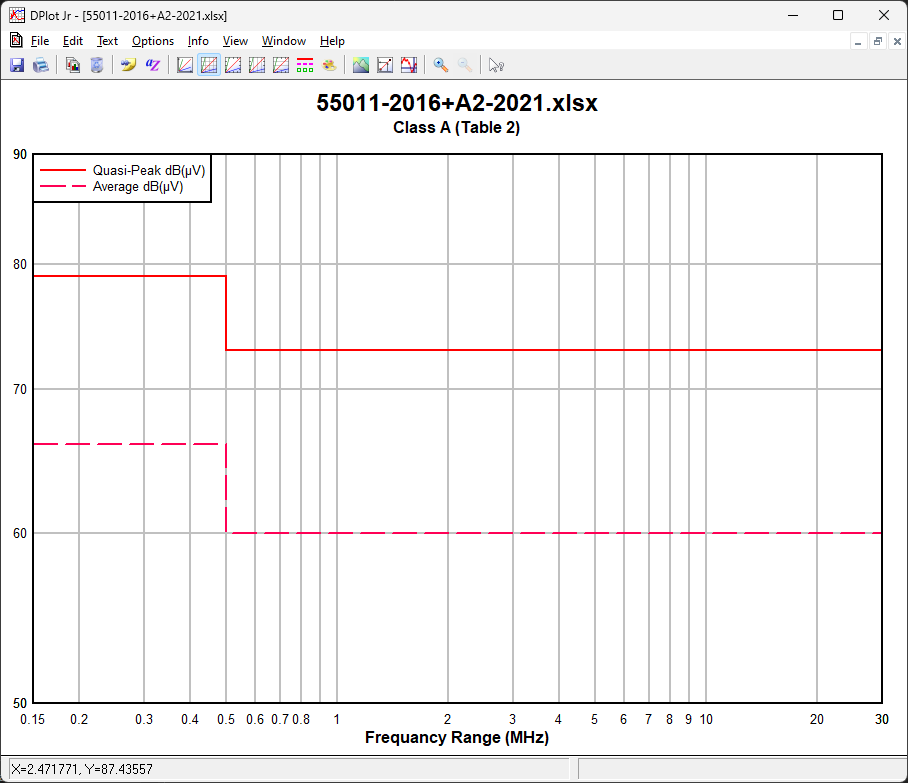
Above is “Table 2 – Disturbance voltage limits for class A group 1 equipment measured on a test site (a.c. mains power port)” from BS EN 55011:2016+A2:2021 (CISPR 11:2015+A2:2019). For this example chart, I want to plot the emissions limits for a DUT with a rated power of ≤ 20 kVA.
| Frequency Range (MHz) | Quasi-Peak dB(μV) | Average dB(μV) |
|---|---|---|
| 0.15 – 0.5 | 79 | 66 |
| 0.5 – 5 | 73 | 60 |
| 5 – 30 | 73 | 60 |
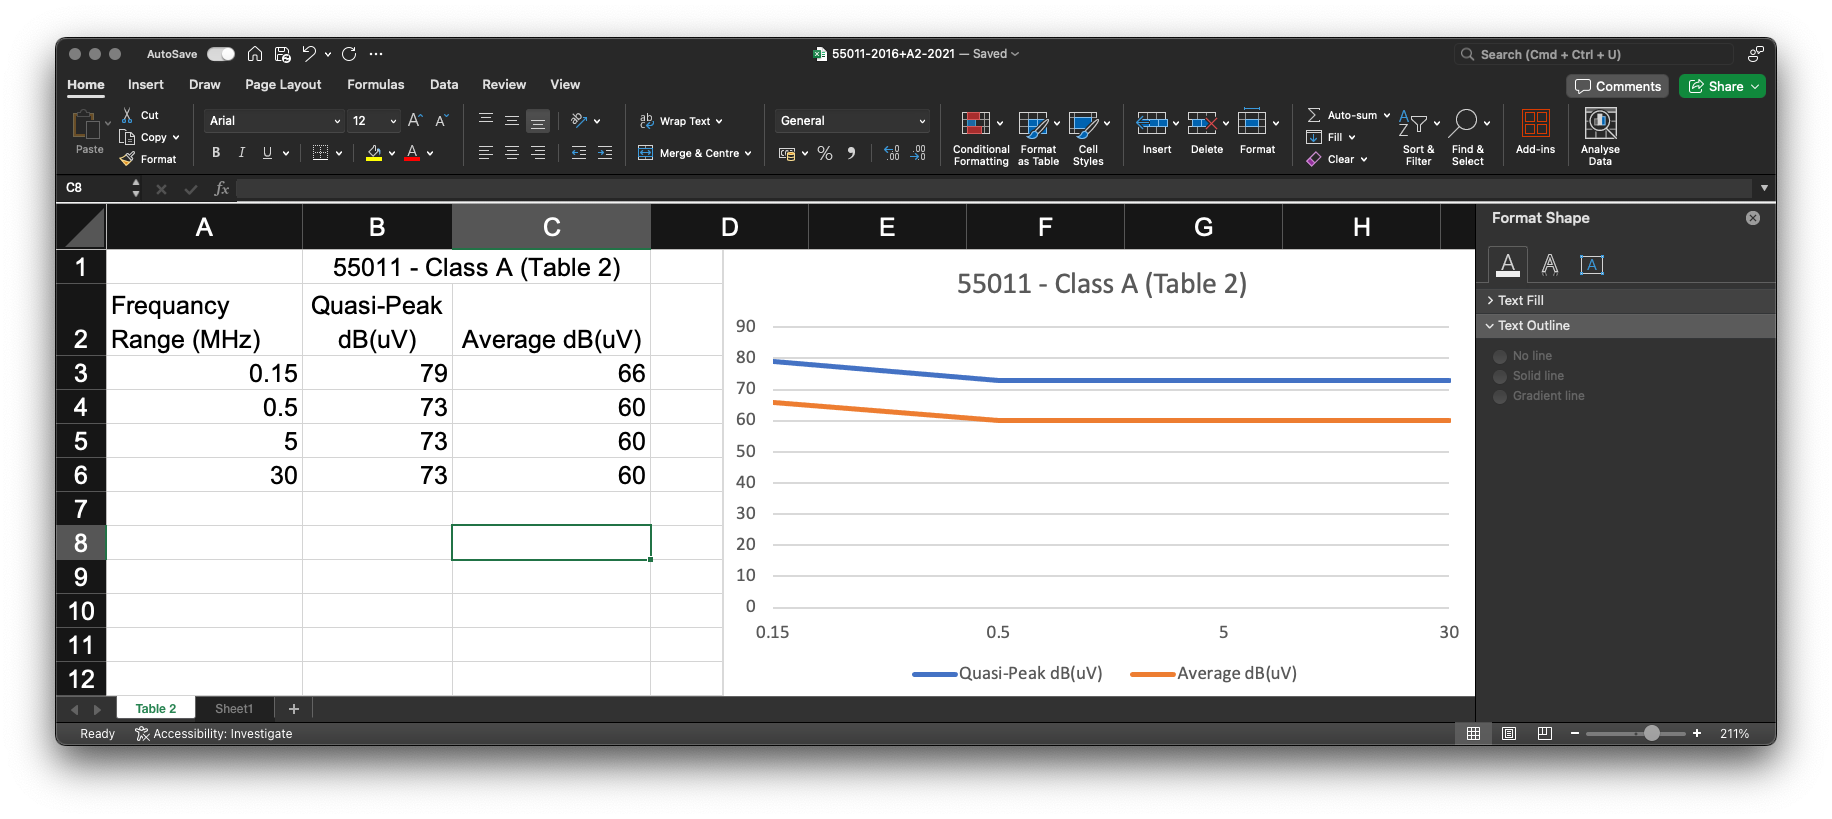
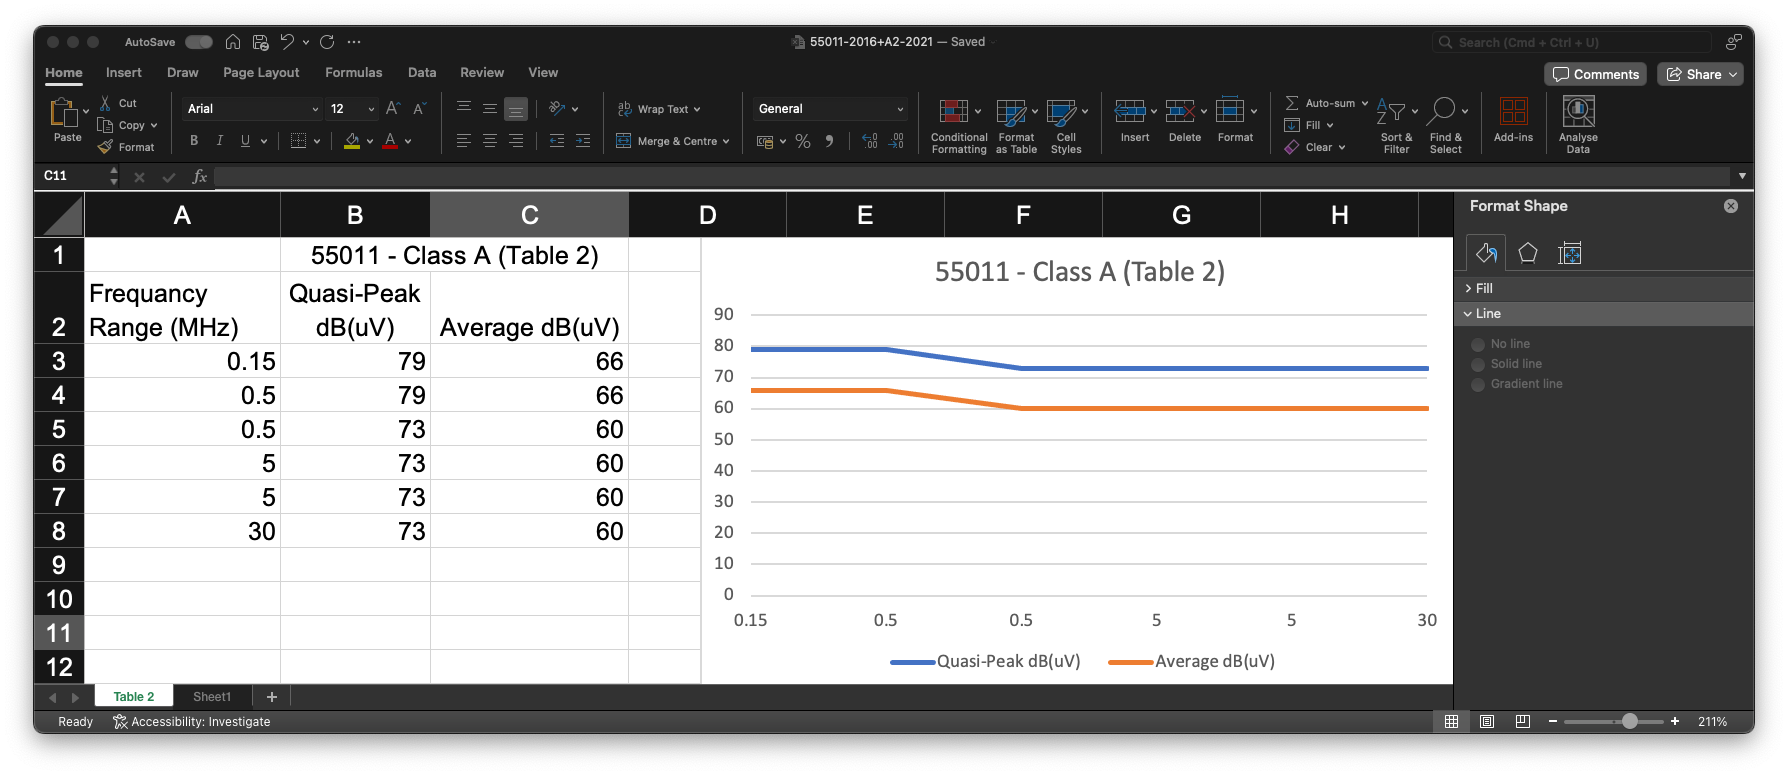
While there is nothing difficult to look at about the data in the table above, both the Frequency Range (MHz) and the Limit are Logarigmithic values, and this is something Microsoft Excel struggles to plot natively.
Using DPlot to plot the Charts
There is an application for Microsoft Windows called DPlot, that works with Excel to make plotting more complex charts easier. The version that you need to download is called DPlot Jr, and while it is harder to find it on the website, is both free and available for download.
Once you have installed it, running it doesn’t do anything interesting, but from this, we can start to make proper charts.
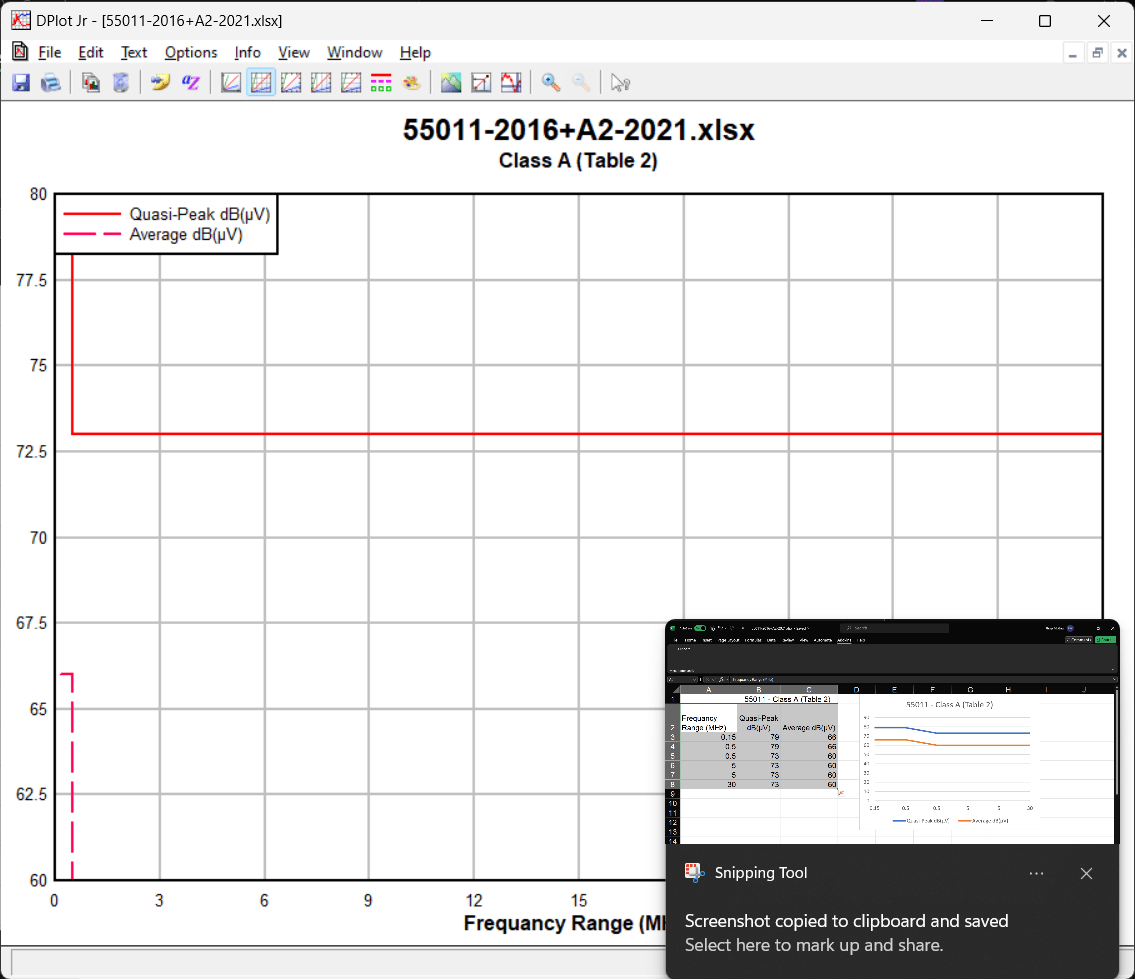
Using the same data as the second attempt at plotting the data from Excel, (I have updated the dB(uV) to dB(μV), and switched back to a Windows machine). Highlighting the data, and from the “Add-ins” menu, select “XYYY” from the DPlot drop-down.
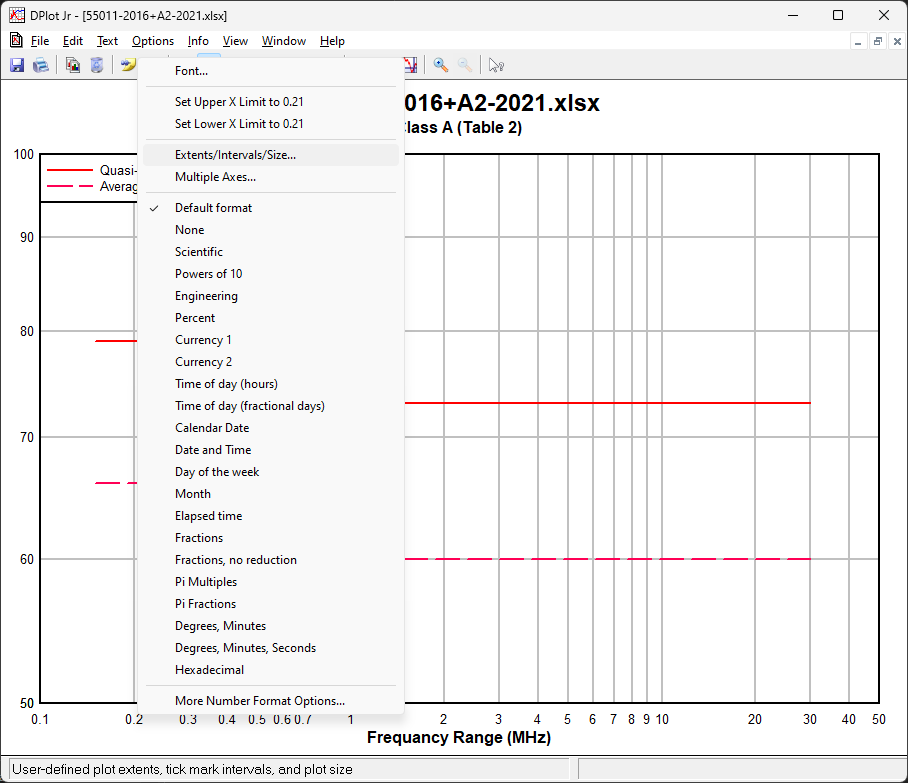
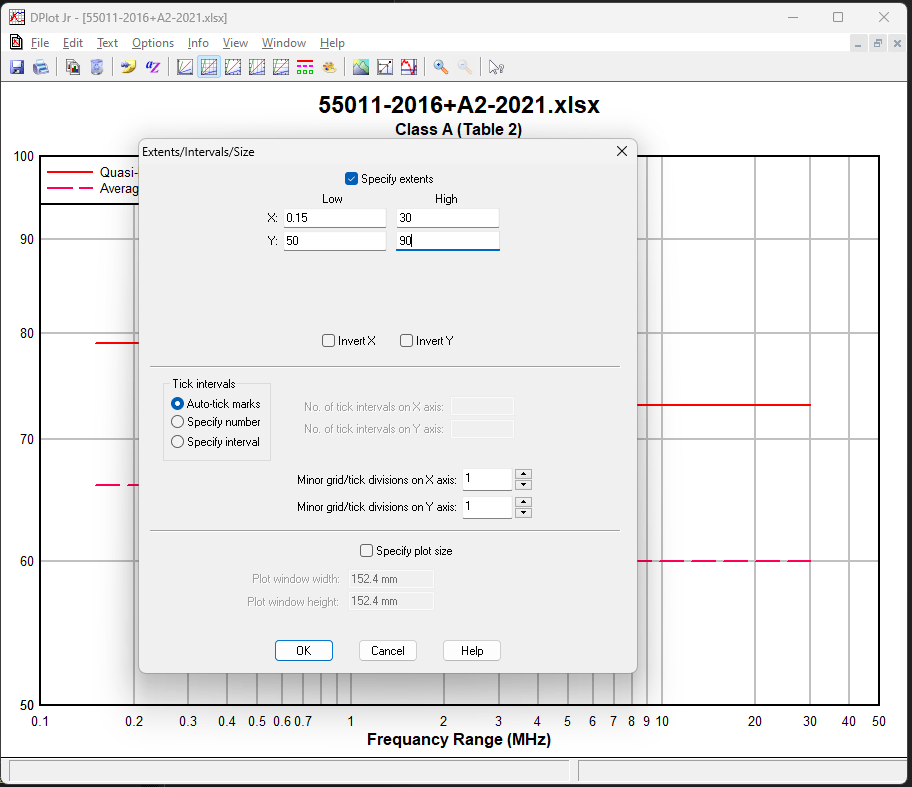
DPlot will now open up the following window:
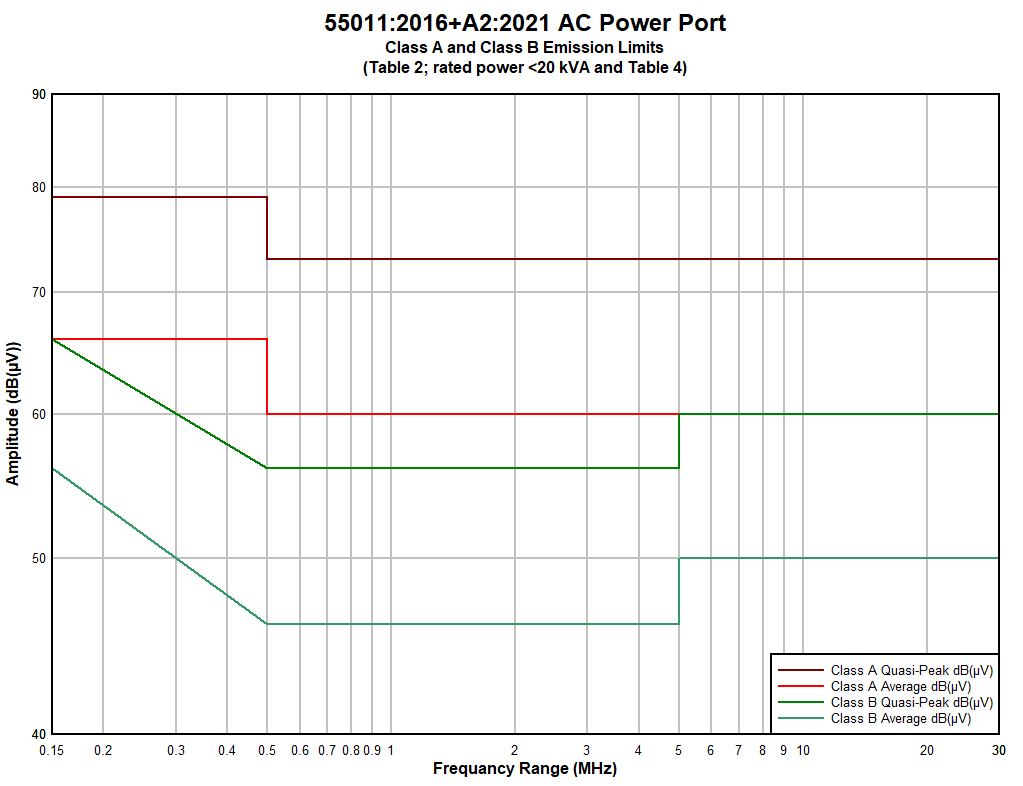
Making DPlot EMC/EMI Charts ‘pretty’
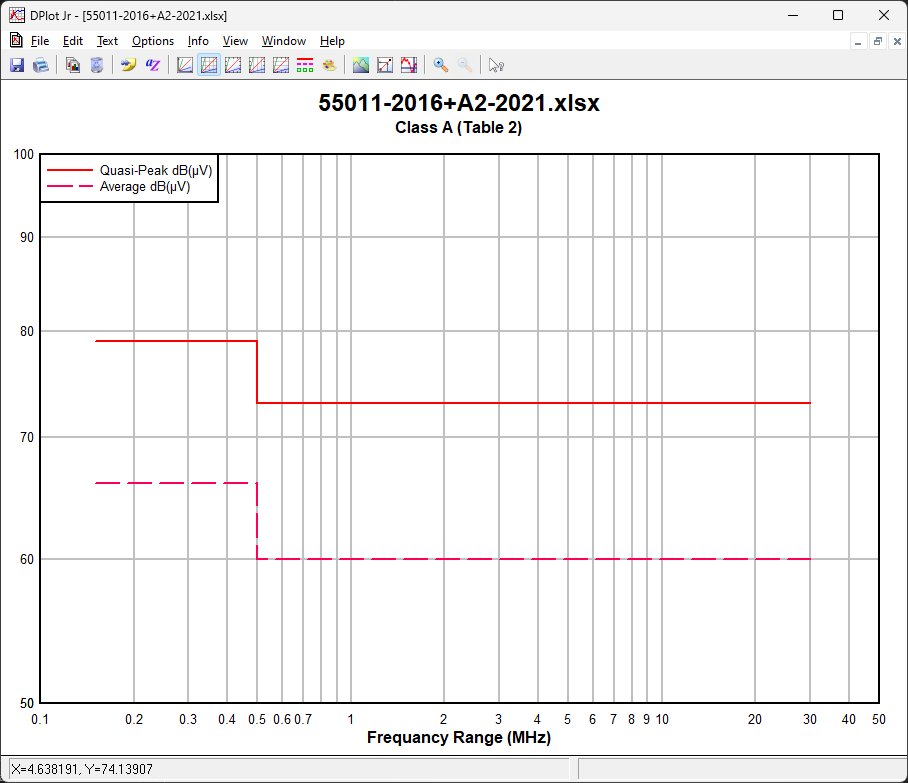
This is a basic introduction to how to use DPlot to make nice EMC / EMI Charts and plots from data in Excel. I have finished up the basic chart below which shows more data, both Class A, and Class B limits.
The Charts can be exported as image formats via the “Save As” menu if you save the charts as a GRF file, it can not be opened with DPlot Jr. The applied settings can be saved and loaded via Get and Save Preferences.
There are examples of test report charts in the post “Autopsy of a Phone Charger from China“, with additional data shown, including the actual emissions and peak values from a spectrum analyser, allowing you to see all the data on one chart.


